FAST & SLOW RELEASE PHOSPHORUS
Phosphorus [P] Release over Time
As a % of Total P
© Copyright in this work is owned by Guano Australia Pty Ltd. All rights reserved.
MADURA GUANO GOLD-KWIK START®
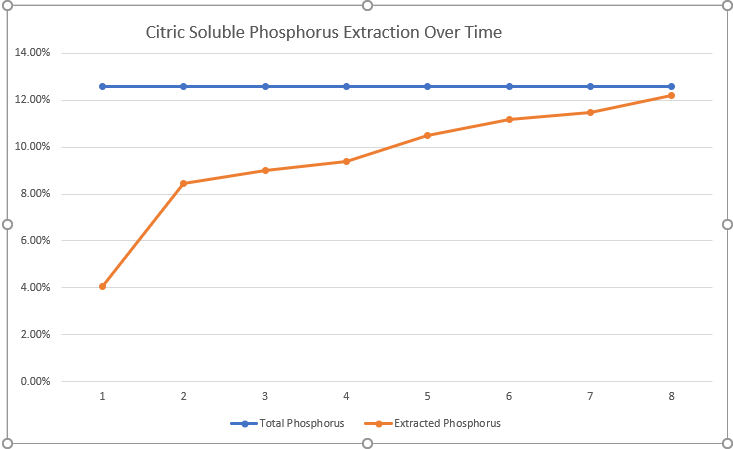
The above graph has been created to give a visual indication of how the phosphorus [P] in the Madura Guano Gold® product is released into the soil medium.
A laboratory experiment was conducted by SWEP to try and replicate the way, over time, the soil around the plant’s root zone changes due to growth of the plant and exudates secreted by the plant roots.
The first reading of 40% is the amount of P released instantly once Guano Gold-Kwik Start® is exposed to a 2% citric soluble solution. This equates to 5.5kg per 10kg of P private. The citric soluble solution was then increased by 0.5% gradients. This increase is an indicator to the time that P becomes available after sowing or top dressing. The time would be influenced by soil temperature, type of crop and other soil chemistry, however the graph gives a fair indication of the P release, so it can be used as a tool by farmers and agronomists to predict release of phosphorus.
In individual farming situations, overall the graph indicates 80% of the applied P is released over the crop cycle with 40% of that being quick and the remaining P as shown by the graph constantly drip feeding into the soil.
Taking this information and applying to a cropping program if 10kg of P is required per hectare for a crop then 90kg of Madura Guano Gold-Kwik Start® would supply this amount of P and provide 2.5 kg/hectare of carryover residual P into the next crop.
MADURA GUANO SULPHUR GOLD®
The below graph has been created to give a visual indication of how the phosphorus [P] in the Madura Guano Sulphur Gold® product is released into the soil medium.
A laboratory experiment was conducted by SWEP to try and replicate the way, over time, the soil around the plant’s root zone changes due to growth of the plant and exudates secreted by the plant roots. Citric solution was increased incrementally by 0.5% to a maximum 4%. Citric solution.
This increase is an indicator to the time that P becomes available after sowing or top dressing. The time would be influenced by soil temperature, type of crop and other soil chemistry, however the graph gives a fair indication of the P release, so it can be used as a tool by farmers and agronomists to predict release of phosphorus.
In individual farming situations, overall the graph indicates 95% of the applied P is released over the crop cycle with 40% of that being quick and the remaining P as shown by the graph constantly drip feeding into the soil.

Guano Sulphur Gold® was tested at 1% citric solution then citric concentration increase by 0.5% increments until total Phosphorus release. At 4% citric solution total extraction was achieved. Residue Phosphorus being Non citric soluble component.


